Case Study: Polhemus Technology Used in New Zealand Fisheries Research
The National Institute of Water and Atmospheric Research (NIWA), in New Zealand, carries out fish biomass surveys for the Ministry of Fisheries using acoustic techniques. This involves surveying areas of the ocean with an echosounder that sends out pulses of sound. Echoes are received back from schools of fish and these are recorded for later analysis. Polhemus FastSCAN 3D laser technology was utilized in this research study.
 Echoes From Fish
Using lasers to study how much sound reflects off a fish, a new method of recording three-dimensional shapes is being applied in research aimed at improving assessments of New Zealand's fisheries resources.
The National Institute of Water and Atmospheric Research (NIWA), in New Zealand, carries out fish biomass surveys for the Ministry of Fisheries using acoustic techniques. This involves surveying areas of the ocean with an echosounder that sends out pulses of sound.
Echoes are received back from schools of fish and these are recorded for later analysis. The total strength of the echo from a school is divided by the strength of an echo from an "average" fish to estimate the number of fish present. Therefore we need to know how much sound is reflected from various species of fish – known as their target strength – and how this varies with fish size and orientation. For further details on how fish biomass is calculated using acoustic surveys, see Water & Atmosphere 4(1): 13-17.
This article describes the swimbladder modelling technique for estimating the target strength of fish.
Fish and Their Swimbladders
Many fish have a gas-filled swimbladder used for buoyancy control, for sound production, and as an aid to hearing. Sound reflects particularly well at abrupt changes in density and sound speed, such as between fish tissues and the gas in the swimbladder.
The swimbladder typically generates about 95% of the sound reflected from fish. The remainder comes from the flesh, bones and organs. Hence, acoustic models of the sound reflection from swimbladders are an appropriate way of estimating the target strength of some fish. These models are particularly useful for species where it is difficult to collect data in their natural environment (termed in situ data).
As an example, the results of orange roughy acoustic surveys conducted in 1998 and 1999 suggested that more than 50% of the orange roughy biomass was to be found on, or just above, flat seafloor outside the main spawning concentrations or away from the main spawning hills. One of the primary uncertainties in the estimates of orange roughy biomass on these flat areas is the target strength of other species found mixed with the orange roughy. The target strength of these species is unknown or poorly known, reducing the accuracy of the orange roughy biomass estimates.
Modelling the Swimbladder
Swimbladders often have complex shapes with many ridges and hollows, which makes them difficult to measure. Because we cannot derive exact mathematical equations for the target strength of these swimbladders, we use a technique that divides the surface into many small regions and then sums the contributions from each region using a formula called the Kirchhoff integral. This produces an estimate of the scattering from the whole swimbladder.
But how can we map the three-dimensional (3D) surface of the swimbladder?
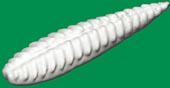
First we take a freshly caught dead fish and inject resin into its swimbladder. Knowing how much resin to inject is a bit subjective, and as a rule we use a volume of resin equivalent to the volume of gas required to keep the fish neutrally buoyant. (This is obtained by weighing the fish in air and then in seawater – the difference is the amount of positive or negative buoyancy of the fish). The resin is left to set, after which the resin cast is removed from the fish and cleaned. This gives us a reasonably accurate cast of the swimbladder, and the procedure is sufficiently easy that we have collected, to date, over 400 casts from 28 species of fish.
In the past we obtained a 3D representation of each cast surface by first slicing it every 1 to 10 mm, depending on the smoothness of the cast shape. The swimbladder shown in the illustrations would have been cut into about 150 slices. Each two-dimensional slice was then digitised, and finally the 3D shape reconstructed using a computer program. This process was very laborious, prone to errors, time-consuming (several hours to several days per cast) and it destroyed the cast.
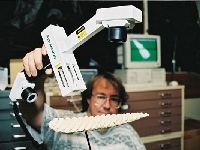
To improve upon this, we have started using a new method. A handheld 3D laser scanner is used to scan in the cast quickly and easily – the time taken is now a few minutes, and the cast is left intact. The photograph shows one of the authors scanning a swimbladder cast from a hake (Merluccius australis), and the figure above shows the resulting 3D image.
The FastSCAN scanner has considerably improved the quality of the 3D data and has also allowed us to scan several hundred casts very efficiently.
 In the ocean, fish swim at various tilt and roll angles, and this needs to be taken into account. So our next step is to calculate the target strength of the digitised swimbladder casts at various orientations. Also, the casts are scaled to simulate fish of different sizes and the target strength calculated. The results from swimbladders of different-sized fish for each species are used to estimate a general relationship between fish length and target strength for each species.
Interpreting the Results
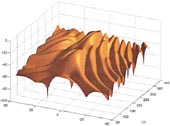 The relation between target strength, fish size and tilt for a hake swimbladder is shown in the graph.
The general form of the relationship is common to many species. As the swimbladder tilts, the effective size of the swimbladder decreases as viewed from the direction that the acoustic wave is travelling and, because a smaller object reflects less sound, the target strength decreases. The pronounced low values in the curve occur at angles where sound scattered from one part of the swimbladder cancels out sound scattered from another part of the swimbladder. For low values of fish length/acoustic wavelength (L/l), the variation of target strength with tilt angle is relatively smooth and gradual. As the fish gets larger (or the acoustic wavelength decreases – which is the same as increasing the frequency), the variation in target strength with tilt angle becomes more rapid and contains more very low values.
Modelling has given us target strength estimates for some species for the first time, leading to improved acoustic biomass estimates. Further research is planned that will use the 3-D swimbladder models to investigate ways to identify the species of the fish using just the acoustic echo.
Learn More:
- FastSCAN
- Download PDF
- Contact sales@polhemus.com for product information.